Explore spatial omics at molecular resolution with 
CartoScope brings high-resolution spatial omics to your browser through seamless, interactive, multi-layered maps for intuitive visualization and analysis — scaling to billions of molecules at sub-micron resolution, unifying data across various platforms.
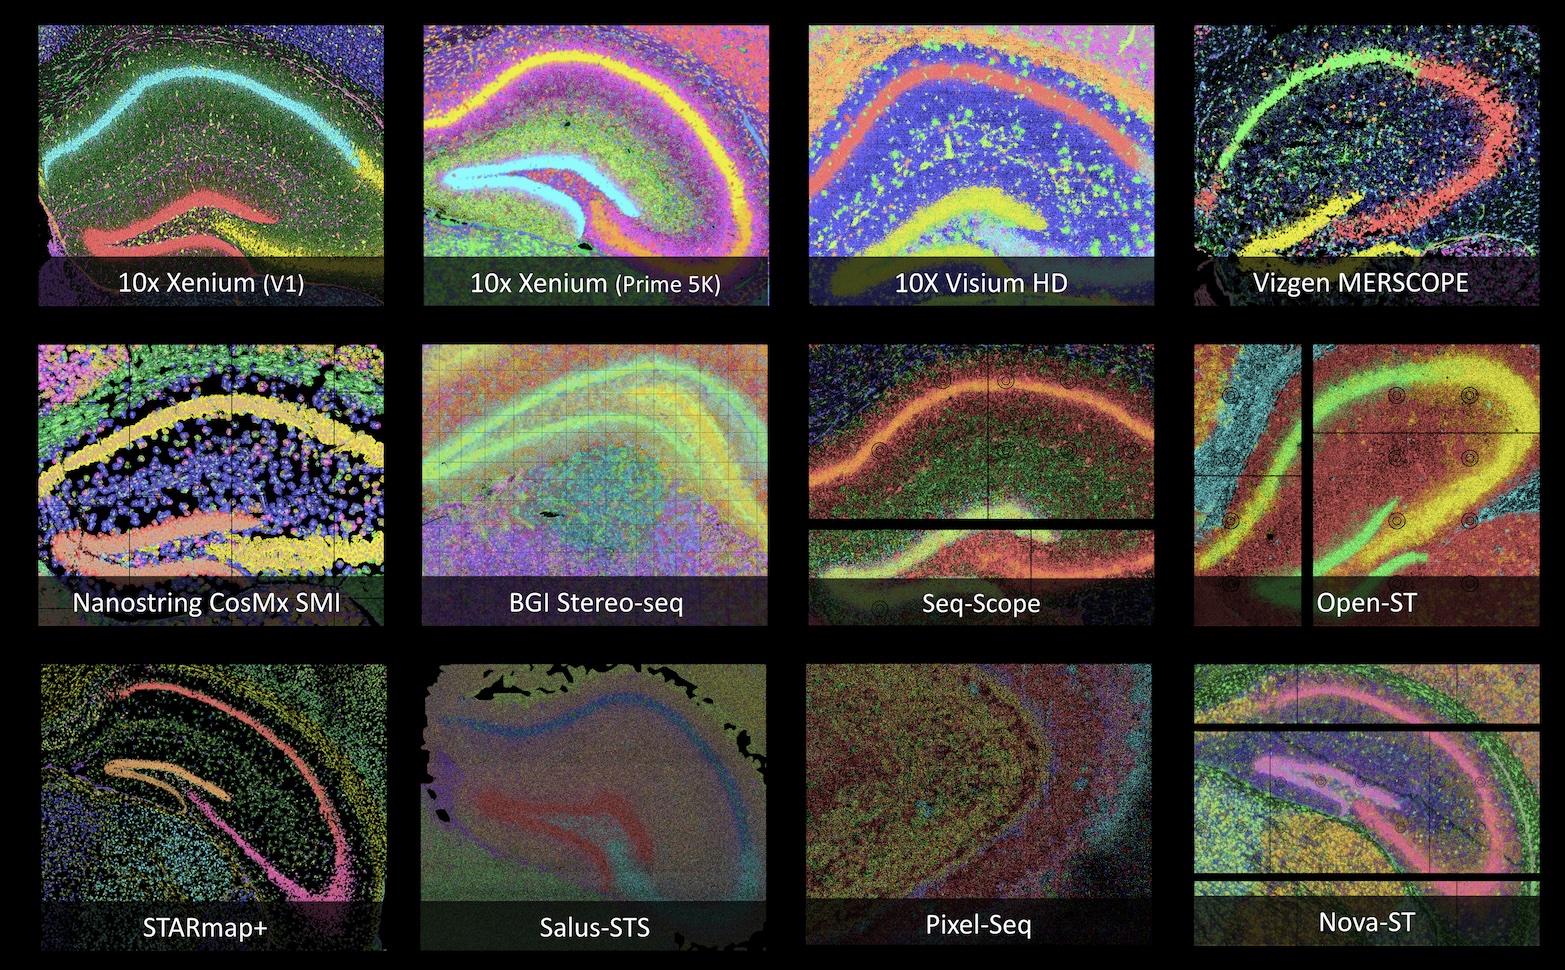
Compatible Platforms
CartoScope is compatible with a wide range of microscopic-resolution spatial omics platforms, including, but not limited to existing commerical and academic platforms:
Hover over each technology to preview an example dataset, then click to explore.
Hover over a technology chip on the left to start...
Features
CartoScope empowers you to explore spatial transcriptomics datasets with unprecedented scale, precision, and clarity.
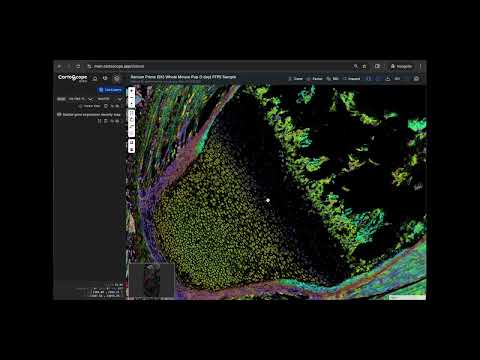
Explore Billions of Molecules at Ultra-high Resolution
Navigate massive spatial omics datasets with a fluid, Google-Maps-like interface. CartoScope efficiently streams billions of transcripts and proteins across thousands of genes at submicron resolution, allowing you to zoom from a whole-tissue view down to individual molecules seamlessly.
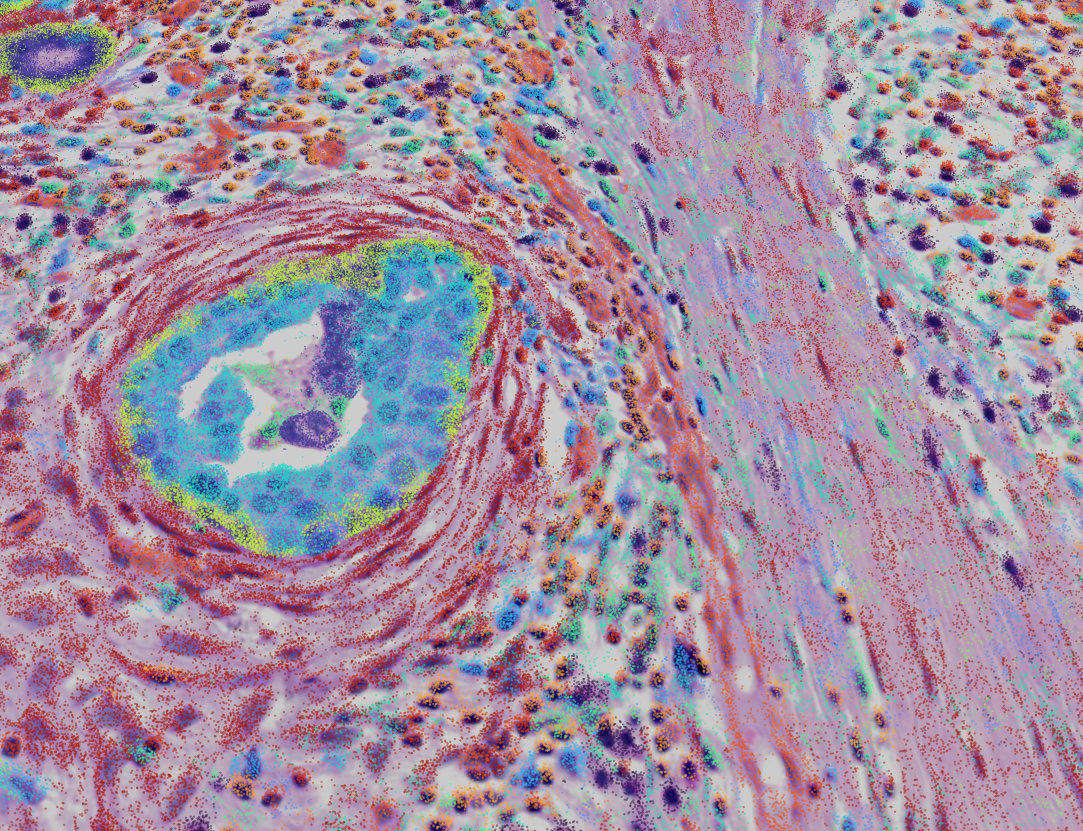
Molecular-resolution Inference with FICTURE
Visualize fine-scale tissue biology that cell segmentation misses. CartoScope reveals detailed tissue architecture at molecular resolution with FICTURE, preserving spatial accuracy and complexity while overcoming the barrier of histology-based segmentation bias.
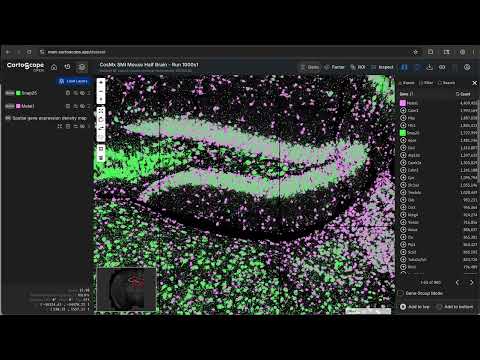
Unified Multimodal Visualization and Exploration
See the complete biological context by overlaying diverse data layers. Seamlessly toggle and align histological images (H&E, DAPI) with cell-level analysis outputs, molecular inference results, spot/square-based summaries, and individual genes —enabling exploration with rich, end-to-end spatial context.
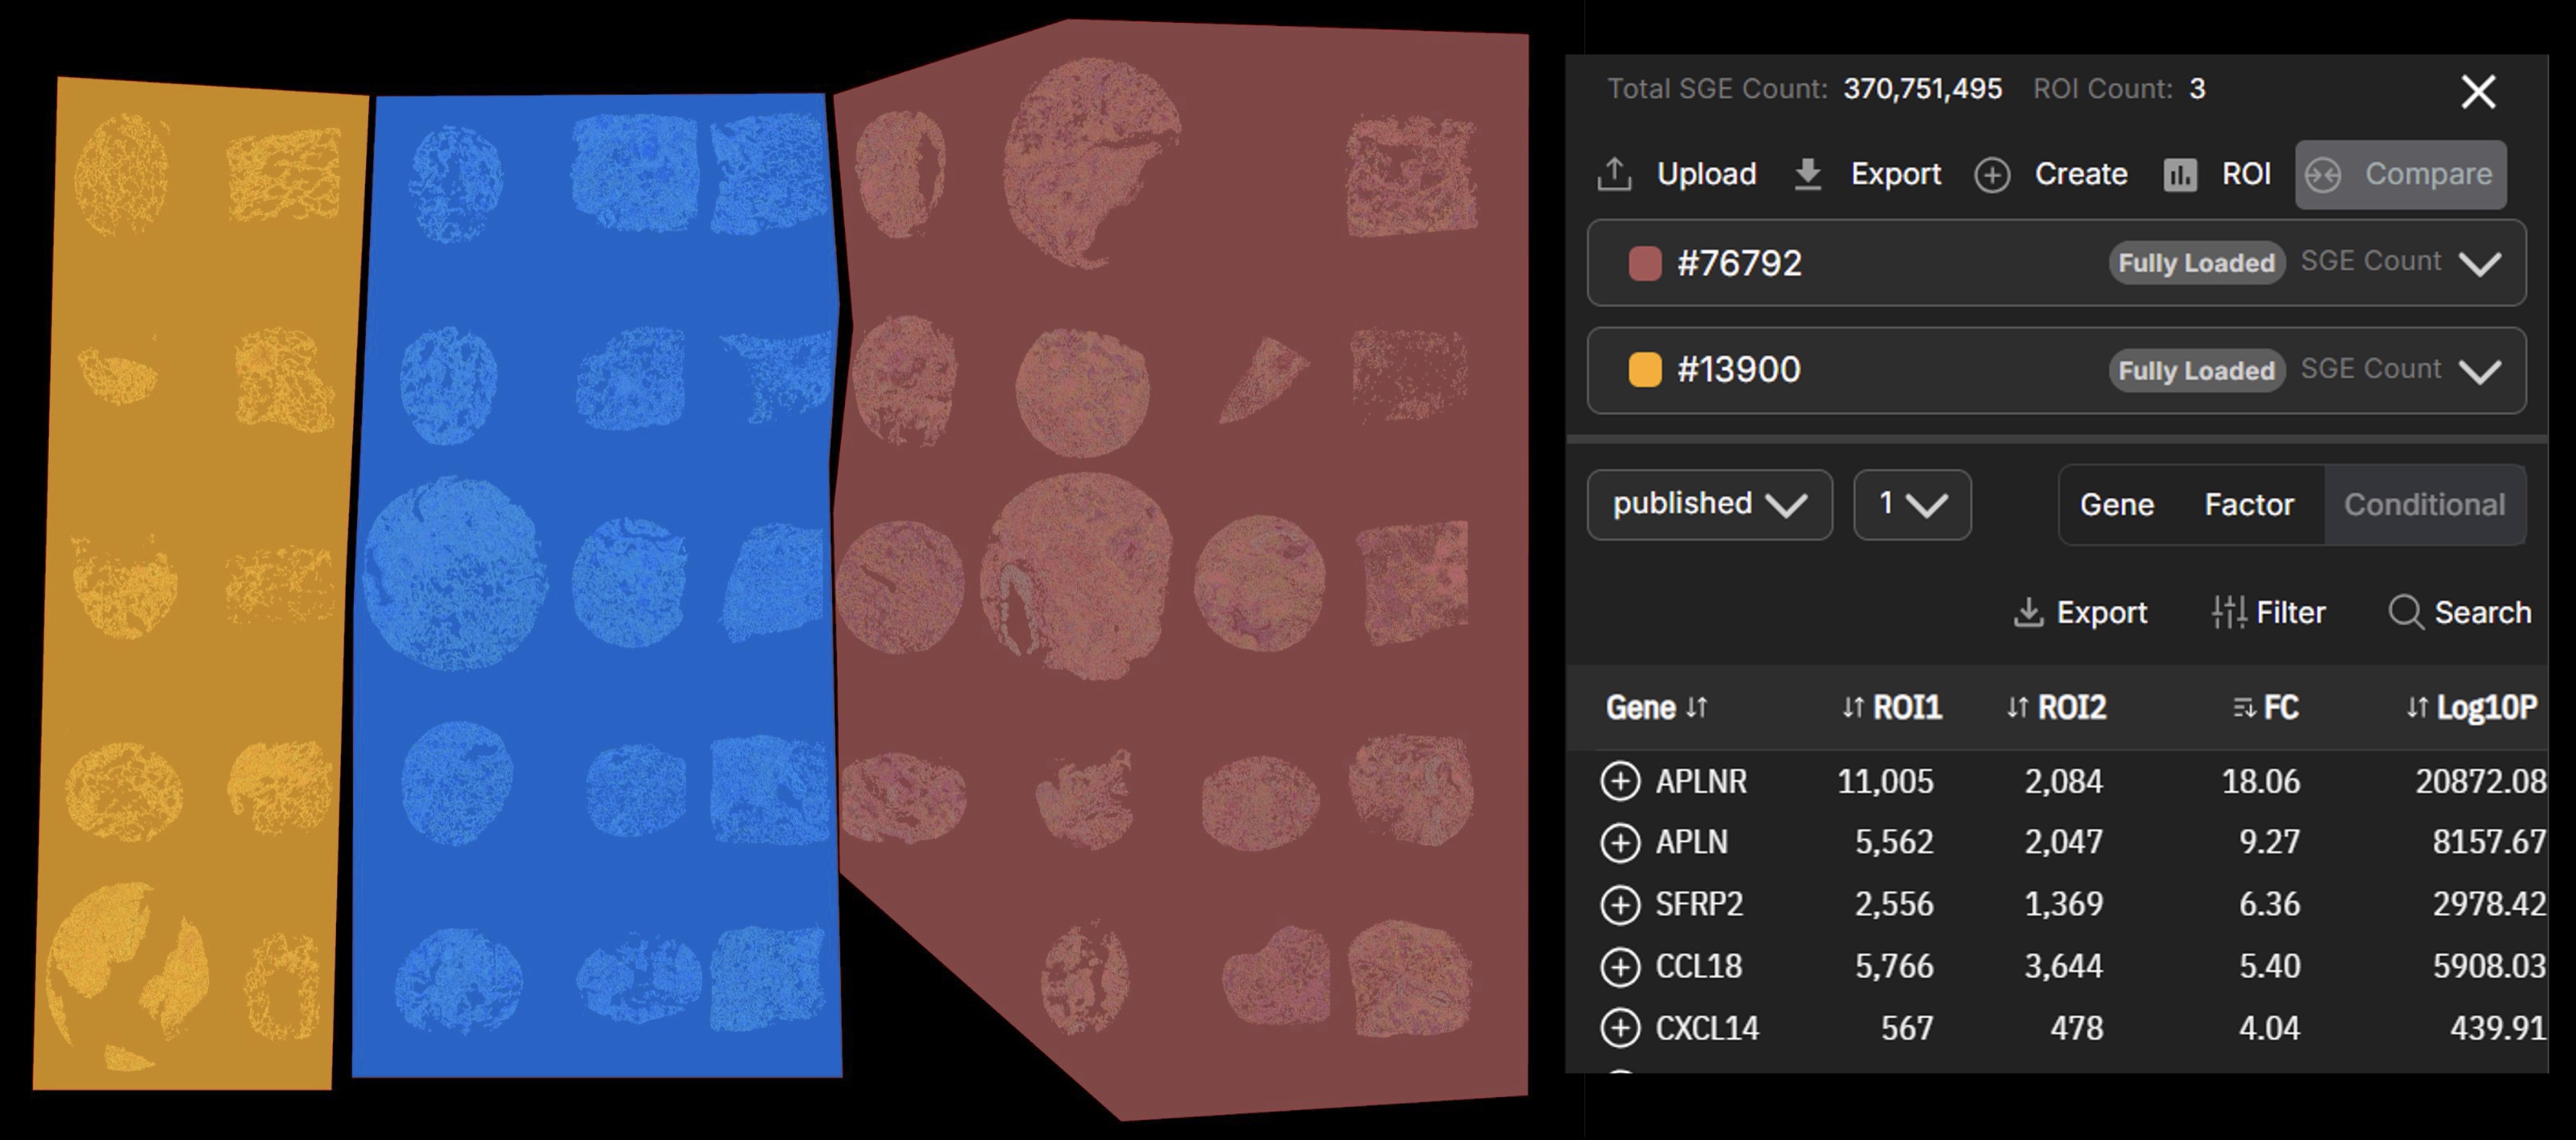
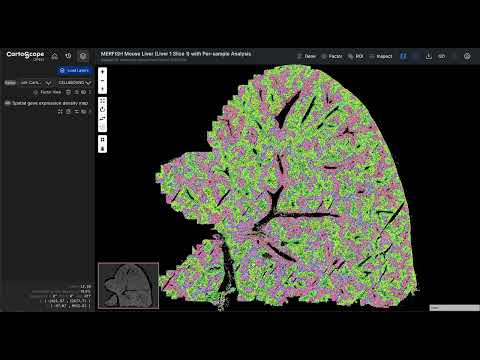
Instant On-demand ROI Analysis
Move beyond static viewing. Interactively draw arbitrary Regions of Interest (ROIs) on the map to instantly generate statistics, identify marker genes, or run differential expression analyses between selected tissue structures directly in your browser.
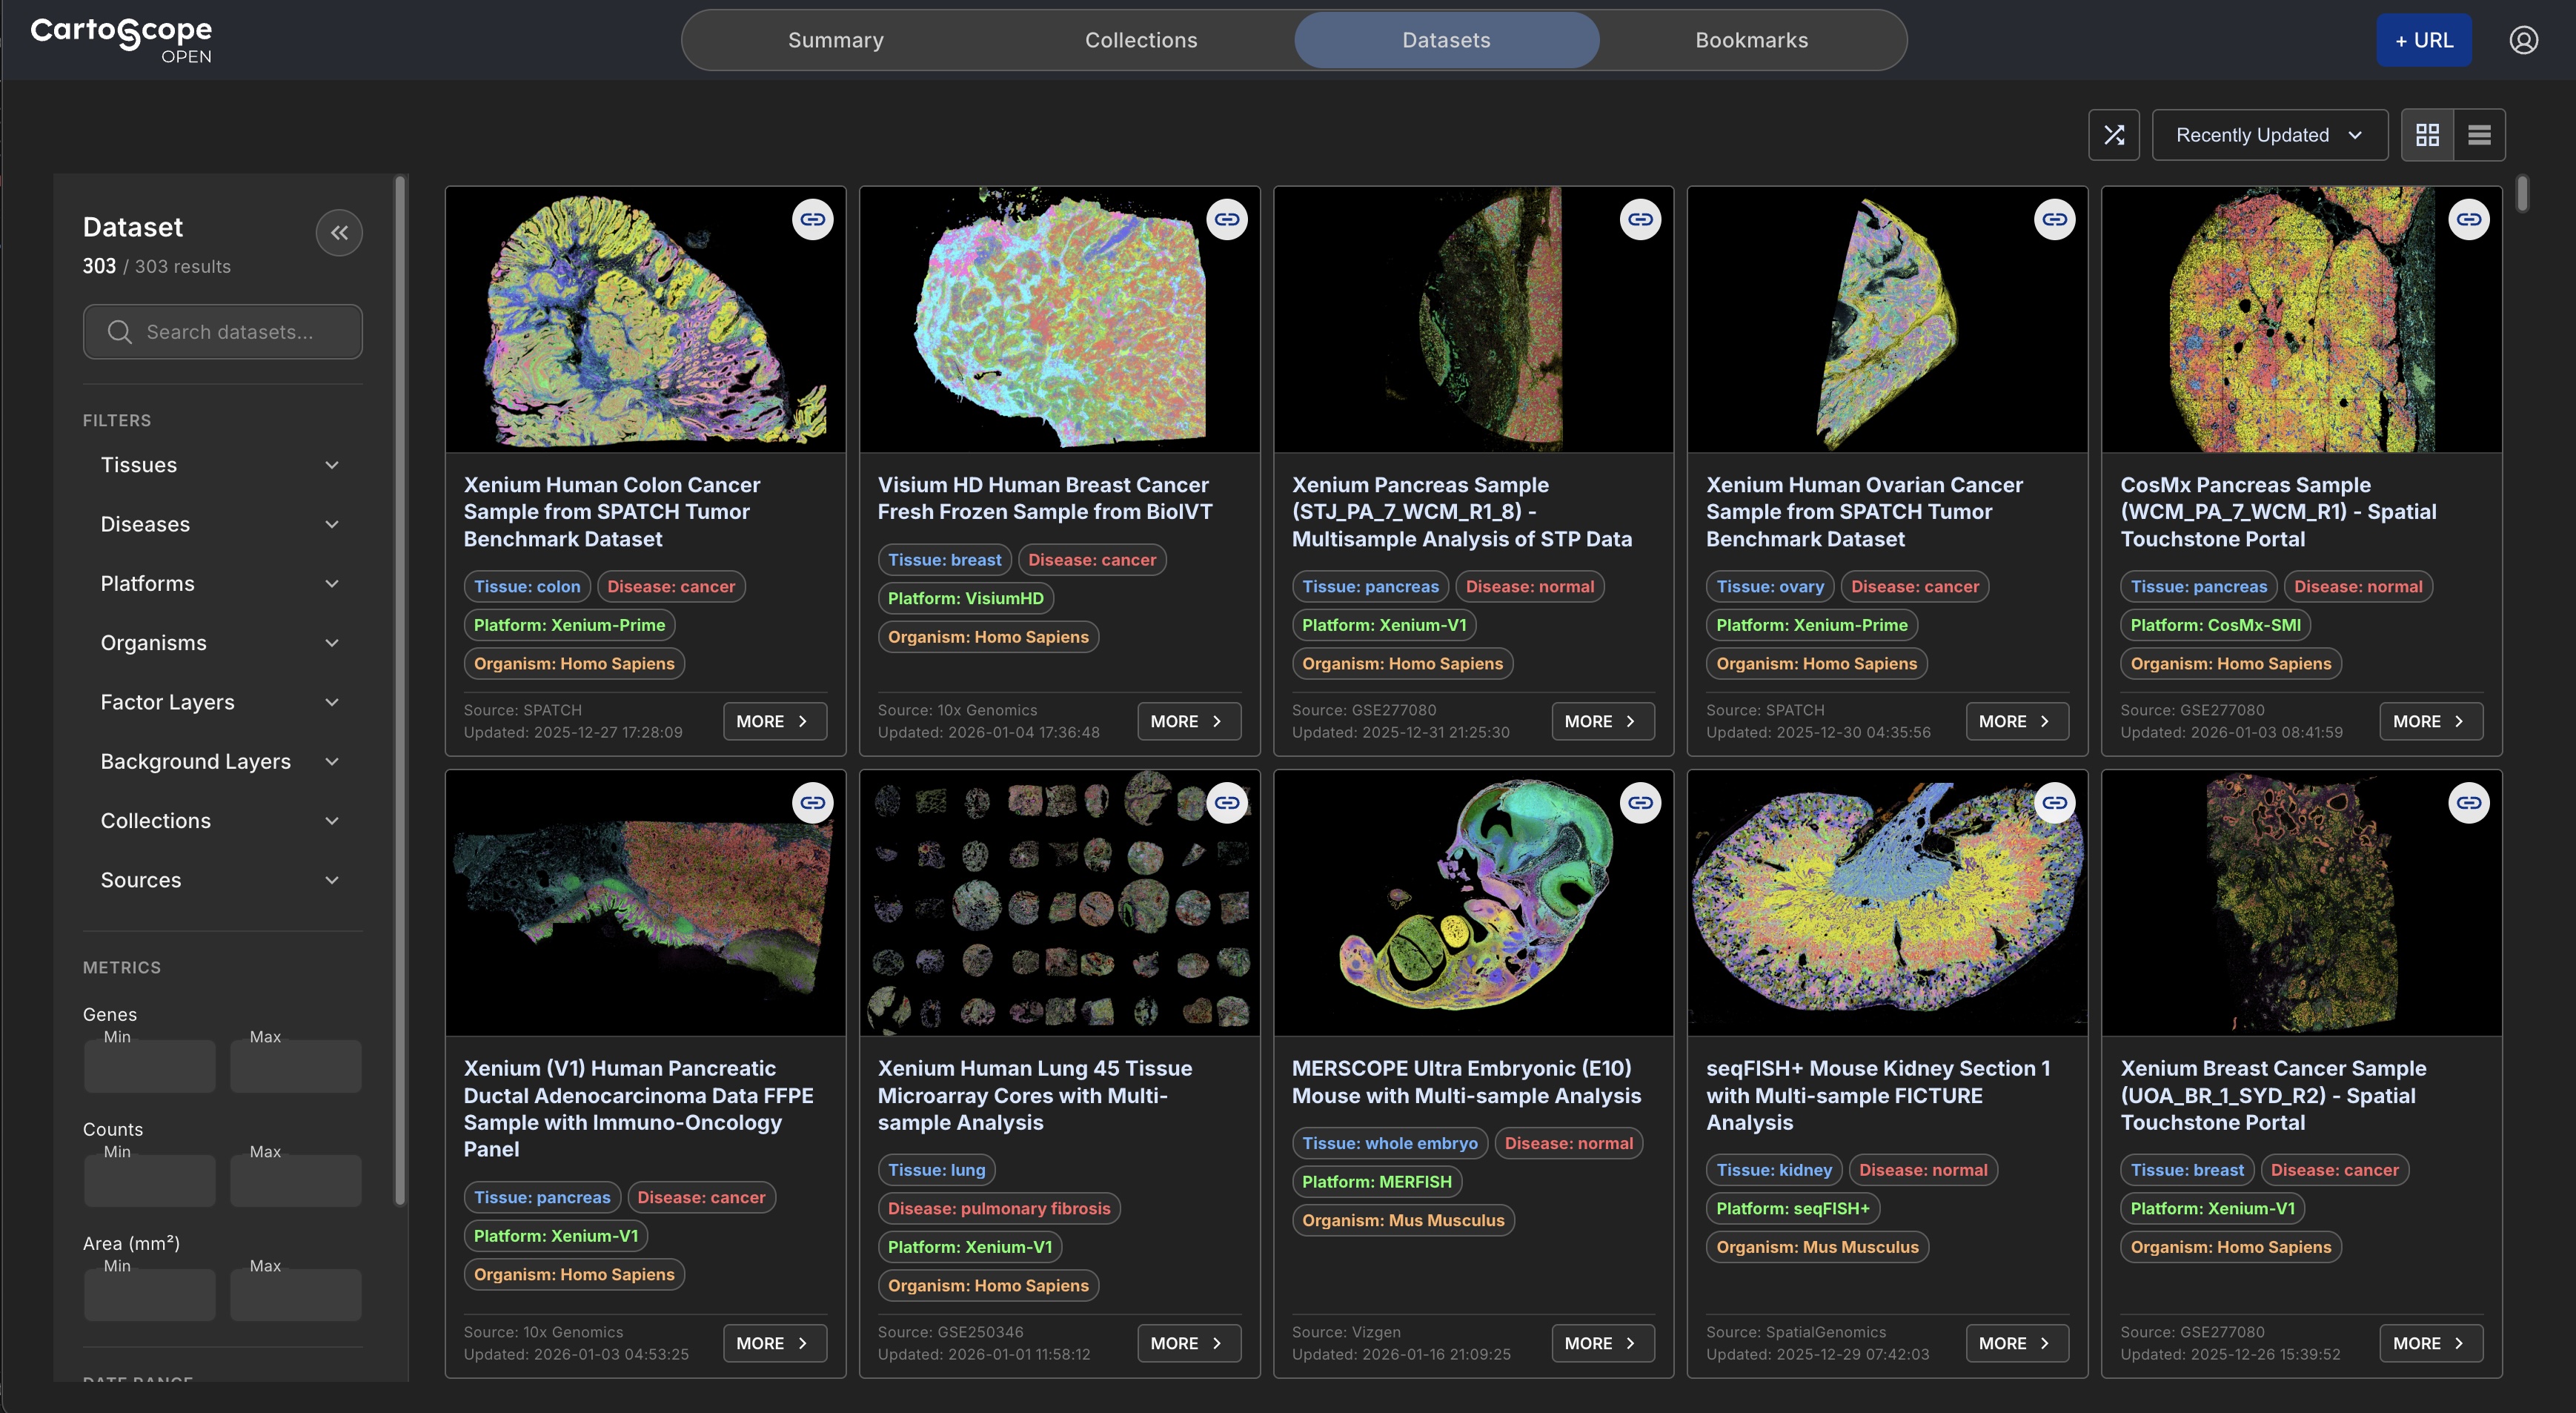
Democratized Access to Spatial Omics
Access a cost-free, harmonized repository of hundreds of curated public spatial omics datasets via CartoStore, powered by the AWS Open Data Sponsorship Program. CartoScope ecosystem democreatizes access to spatial omics data following the FAIR (Findable, Accessible, Interoperable, and Reusable) data principles.
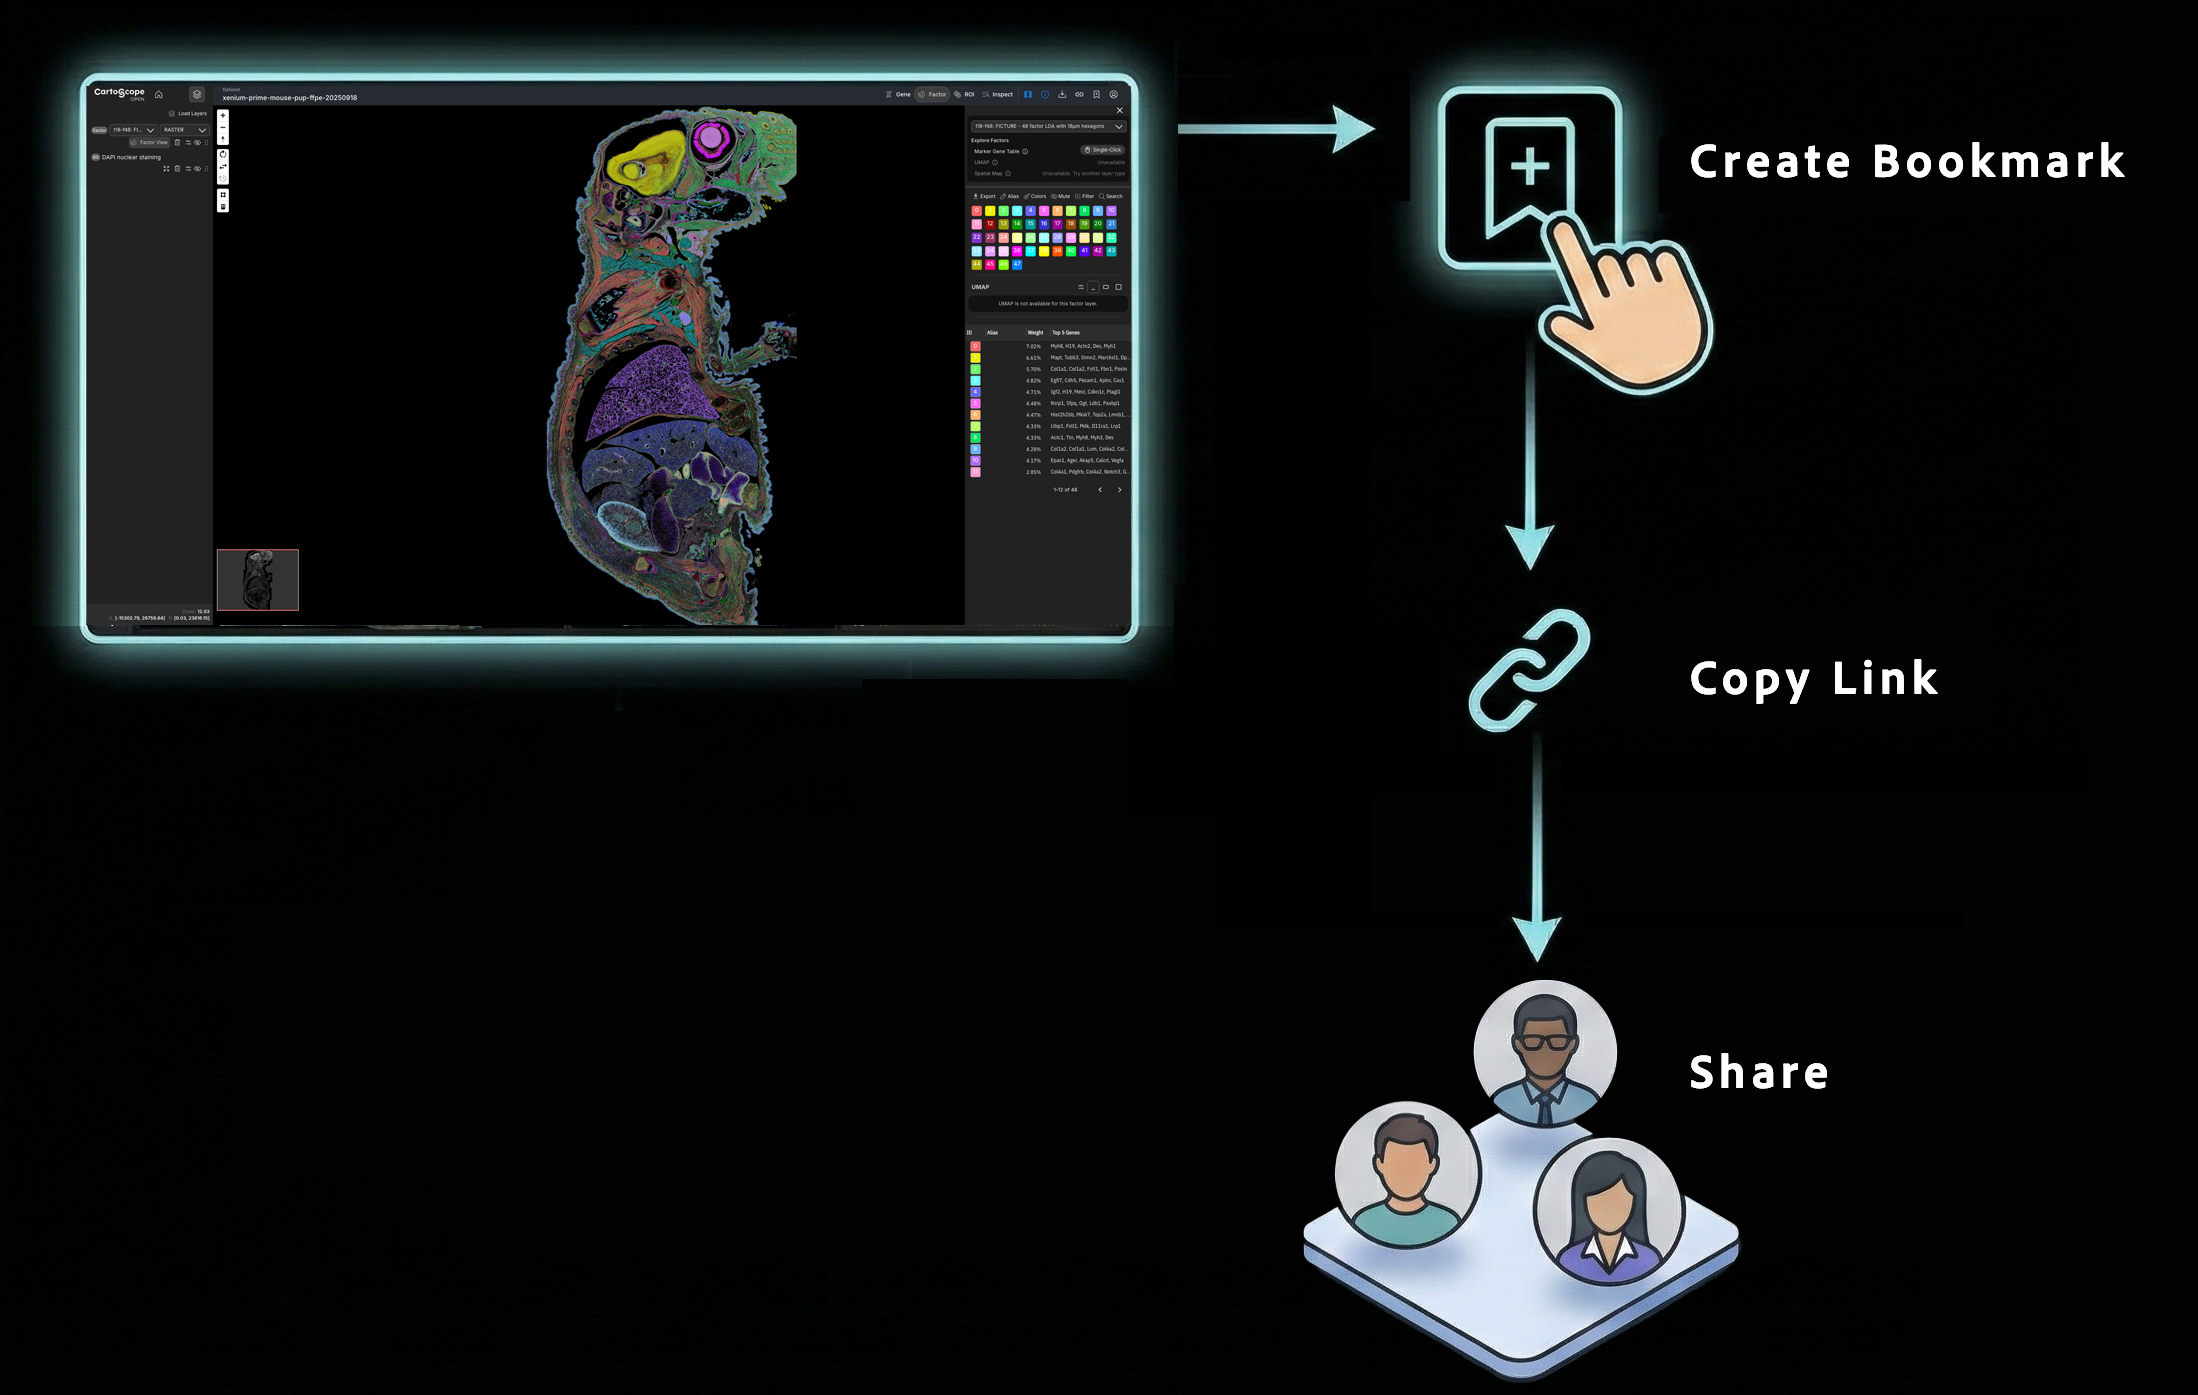
Save, Share, and Collaborate
Universal Cross-Platform Support
Analyze data from any major technology in one consistent interface. CartoScope unifies visualization for high-resolution spatial omics platforms — Xenium, MERFISH, Visium HD, CosMx SMI, Stereo-seq, Seq-Scope, STARmap+, Pixel-seq, Singular G4X, and Salus STS — enabling you to compare datasets across different platforms side-by-side, powered by the CartLoader pipeline..
CartoScope Ecosystem
CartoScope works alongside these specialized modules to deliver a complete spatial omics workflow—from raw data processing to global dataset discovery:
CartLoader
A Python package that streamlines the entire workflow—from data conversion and FICTURE analysis to cloud upload—enabling users to easily load and visualize their datasets in CartoScope.
-
Cross-Platform Format ConversionConverts raw SGE data from diverse ST platforms into a unified format, enabling consistent downstream processing.
-
Molecular-level Spatial Factor InferenceApplies FICTURE to infer spatial factors directly from pixel-level data, capturing biological patterns without requiring cell segmentation.
-
Multi-Modal IntegrationAligns histology images and all analysis layers (pixel-, cell-, and square-based) into one pixel-accurate coordinate space for direct, cross-modal comparison.
-
Cross-Sample AnalysisSupports joint analysis and SGE stitching across samples or platforms to reveal shared or differential features.
-
Modular and Reproducible WorkflowOrchestrates all steps via Makefile to ensure scalability, transparency, and reproducibility.
CartoStore
A curated data hub hosting public datasets processed via CartLoader, where users can browse the collection and instantly explore spatial omics data within CartoScope.
-
Ready-to-use DatasetsAccess processed, high-resolution datasets immediately for interactive exploration.
-
Broad CoverageSpans diverse species, tissues, and disease models for a wide range of research needs.
-
Growing RepositoryContinuously updated with new datasets as they are processed and added.